10K Wizard provides free acess to SEC EDGAR filings. The flings can
be located by Ticker symbol. You can also search the entire data base
for key words. Registration, which is free, is required for certain
services. 10K Wizard will E-mail to you SEC filings in rich text format
(rtf) files, which can be read by word processors. 10K Wizard also
provides you with income statements and balance sheets for each company.
These financial statements can be downloaded in excel format files.
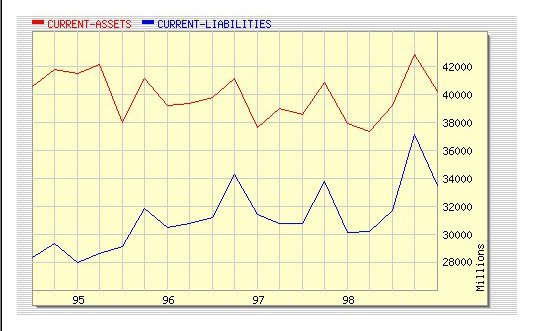
10K Wizard will also create graphs charting financial statement variables
over time.
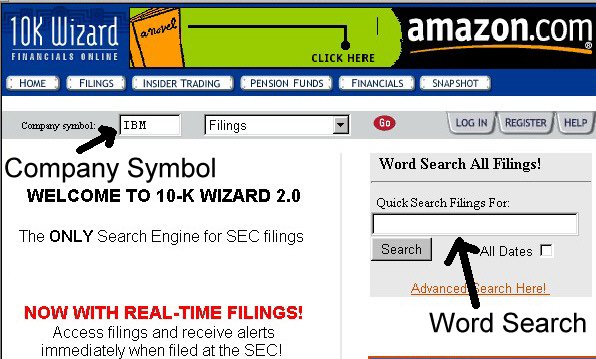
Figure 1
In order to view the SEC filings for a company, enter its Ticker symbol in
the "Company Symbol" box on the home page. Select "Filings" in the
box to the right of the Company Symbol box. If you wish to search all
SEC filings for key words then use the "Word Search All Filings" box.
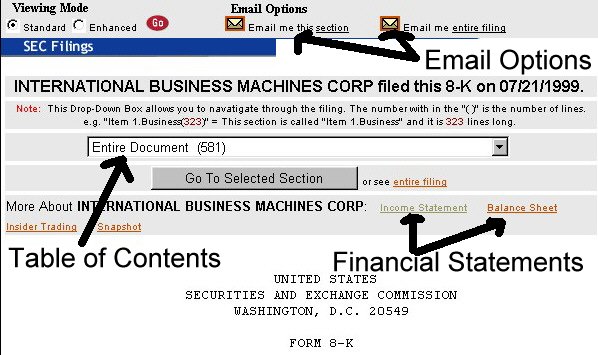
Figure 2
You can select which portion of the filing to view in the "Table of Contents"
box of the SEC Filings page (Figure 2). If you would like some or all
of the filings emailed to you in rich text format (rtf) files, click either
"Email me this section" or "Email me entire filing" under "Email Options".
If you would like recent income statements or balance sheets then click
the desired financial statement under "Financial Statements".
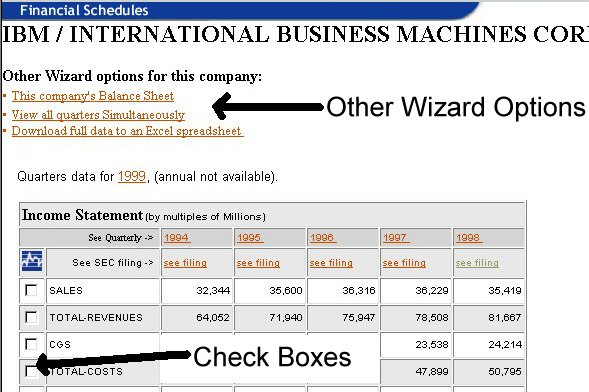
Figure 3
If you clicked a financial statement, the the Financial Schedules page will
open (Figure 3). The annual statements compiled from filings within
the EDGAR database will be displayed. If you click on the year above
each column, you will see the quarterly statements for that year. If
you would like to see the quarterly statements for all of the years within
the database, then click "View all quarters Simultaneously" under "Other
Wizard options for this company". If you would like to download the
financial statements using an Excel format file, then click "Download full
data to an Excel spreadsheet" under "Other Wizard options for this company".
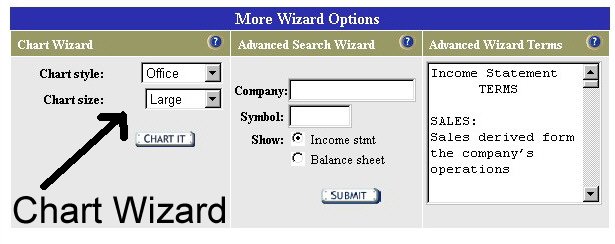
Figure 4
If would like 10K Wizard to create a graph (e.g., Figure 5) charting
variables from a financial statement over time, click the "Check Boxes" next
to the variables that you wish to graph (Figure 3), and click the "Chart
It" button on the "Chart Wizard at the bottom of the page (Figure 4).